-
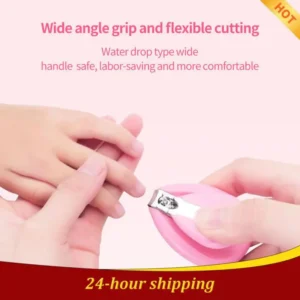
Infant Finger Toe Trimmer No Odor Light Healthy Safety Jaws Prevent Bouncing Baby Nail Care Tools Kids Nail Clippers Anti-fall
$3.45 – $4.11Style AStyle BStyle CStyle DClearCHINA -
Baby Plastic Cleaning Tweezers Safety Care Round Head Clamp Anti-skid Design Clean Ear Holes Nostrils Forceps Babies Daily Care
$6.33 – $21.964 pcs Setblue Ear spoonerDark Blue 10pcsDark Blue 1pcDark Blue 5pcsgreen Ear spoonerMacaron Green 10pcsMacaron Green 1pcMacaron Green5pcsorange Ear spoonerPink Ear spoonerPink Tweezers 10pcsPink Tweezers 15pcsPink Tweezers 1pcPink Tweezers 5pcsyellow Tweezers 1pcClearCHINAUnited StatesRussian Federation


-
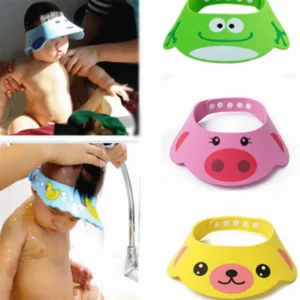
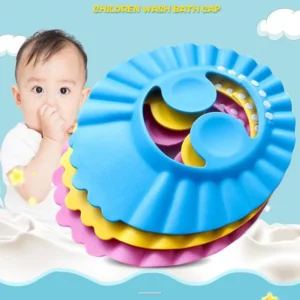
Adjustable Baby Shower Hat Toddler Kids Shampoo Bathing Shower Cap Wash Hair Shield Direct Visor Caps for Baby Care 1pc
$8.28 – $8.31CleargreenPinkYellow -
Cartoon Baby Shower Bath Spoon Head Watering Bottle Todder Kids Wash Hair Bailer Shampoo Cup & Cap Infant Care Tool
$7.41 – $7.62ClearBlue Shampoo CapEar Shampoo Cap-BlueEar Shampoo Cap-PinkEar Shampoo Cap-YellPink Shampoo CapYellow Shampoo Cap -
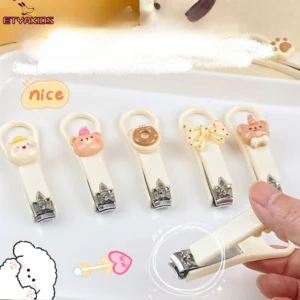
Cute Cartoon Bear Cat Nail Clippers Cutter for Student Girls Beauty Household Nail Trimmer Scissors Baby Nail Care Manicure Tool
$6.30 – $6.57Clearbeige bearBeige cat pawBeige donutBirthday BearBowCoffee donutsHooded catRadish Bearrandom color -
Baby Plastic Cleaning Tweezers Safety Care Round Head Clamp Anti-skid Design Clean Ear Holes Nostrils Forceps Babies Daily Care
$6.33 – $21.964 pcs Setblue Ear spoonerDark Blue 10pcsDark Blue 1pcDark Blue 5pcsgreen Ear spoonerMacaron Green 10pcsMacaron Green 1pcMacaron Green5pcsorange Ear spoonerPink Ear spoonerPink Tweezers 10pcsPink Tweezers 15pcsPink Tweezers 1pcPink Tweezers 5pcsyellow Tweezers 1pcClearCHINAUnited StatesRussian Federation -
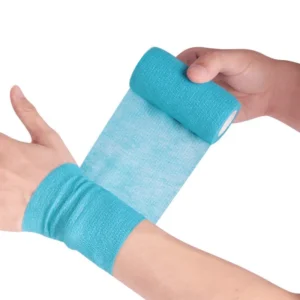
1 Roll 2.5/5/10cm*4.5m Gauze Bandage Self-adhesive Breathable Elastic Bandages Sports Fixing Finger Wrist Leg Baby Care
$7.50 – $9.21BluegreenRedblackPURPLESkinSKY BLUEWhiteClear10CMx4.5M2.5CMx4.5M5CMx4.5M7.5CMx4.5M -
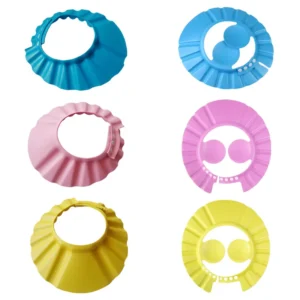
Adjustable Baby Swim Cap Bath Shampoo Eye Protection Head Shower Water Cover Baby Care Wash Hair Shower Cap For 0-6 Years Kids
$3.79 – $12.76ClearBlue 1Blue 2Blue 4Pink 1Pink 2Pink 4Yellow 1Yellow 2Yellow 4